Marko Oja
Marko helps customers to understand the endless possibilities of technology and to transform innovative ideas into technical solutions. Agile methods and process development are close to his heart.
I 💙 pandas, I really do. And I also like to do data profiling. So I can’t possibly go wrong with panda profiling, right? Well, jokes aside, in my opinion data profiling should, at least to some extent, be a standard practice in all data processing work. For me and for many of my colleagues our history with data development goes far further than to the time before we had all these nice tools we have now, though. The process of checking data issues has previously been mainly manual. Some of us who are lazy enough may have written some small patches of code to help seeing the bigger picture with our data sets. But for far too many, data profiling hasn’t been a part of data development practices in any way. And very often when I have been consulting on problems in data analysis and other data utilisation cases, root causes have been found in the data quality being bad, or from false assumptions regarding what the data should be.
It is no surprise that tools to tackle these issues arise from the ML development sector. In that kind of exploratory development we are looking for behaviours that are not obvious. Otherwise why would I need to create a complex mathematical model if a simple calculation does the job? So the mindset is noticeable different. When conducting an investigation process we are trying to find new behaviours, where as in more traditional data development we “know” what the data is suppose to be and what process it should present. Thinking we already know all the answers leaves us clueless of underlying issues if we don’t search for them. And true enough an experienced data developer knows to check for underlying issues that could affect the load processes or calculations. That said, it would be nice if checking for these issues was a bit easier, wouldn’t it?
So as you would expect, Pandas profiling-library comes from the world of Python data development. While Python might not traditionally be the industry standard tool to create enterprise level data pipelines, the bridge has shrunk dramatically during the new age of cloud data development. Tools like Databricks, Synapse Spark and others are already quite commonly adopted in cloud data platforms. And Python is one of the most commonly used languages with these tools. So I don’t think it is too much to ask from my fellow data developers to consider using something that would be available on top of that stack. Even if we need to go a bit out of our comfort zone. Also there is the point that if it is easily available, then is there really any good reason not to use it? I promise it’s not hard. And, especially for an old(er) developer like me, the things you can discover are nothing short of heart-warming.
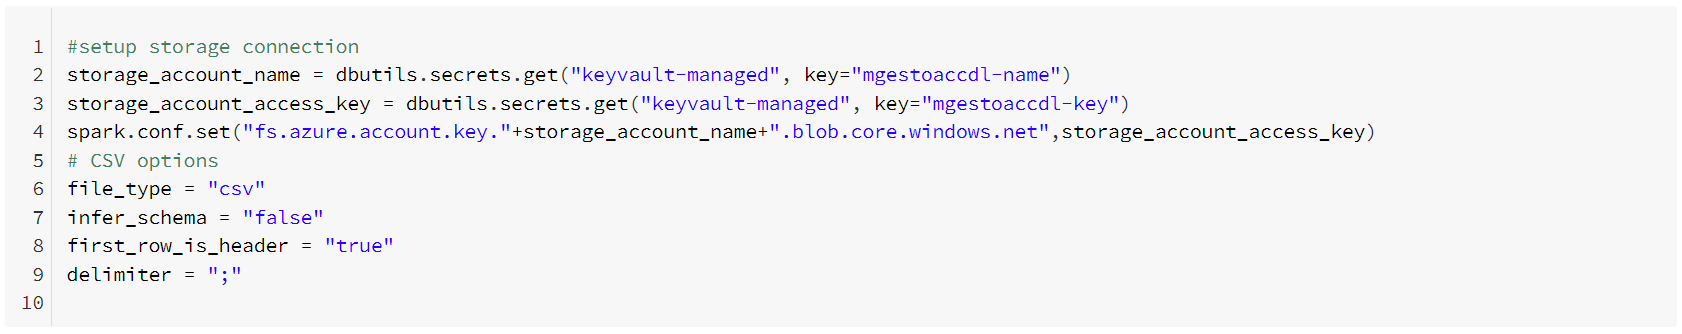
Let’s start from the basics: loading data to Databricks. Simple enough – I’ll just push my files to blob storage. That can be easily done trough the Azure portal. Not going to explain this further. I trust everyone knows how to upload a file via a web browser. Now we get to the part where we need to do some coding. I have set up a Databricks workspace and added a link to key vault via secret scope but you can use plain strings directly in your notebook if you want just to test things out.
Basic setup for a data connection to Azure storage account looks simple and easy.
And after setting up a connection, reading a file into a spark data frame is a breeze.
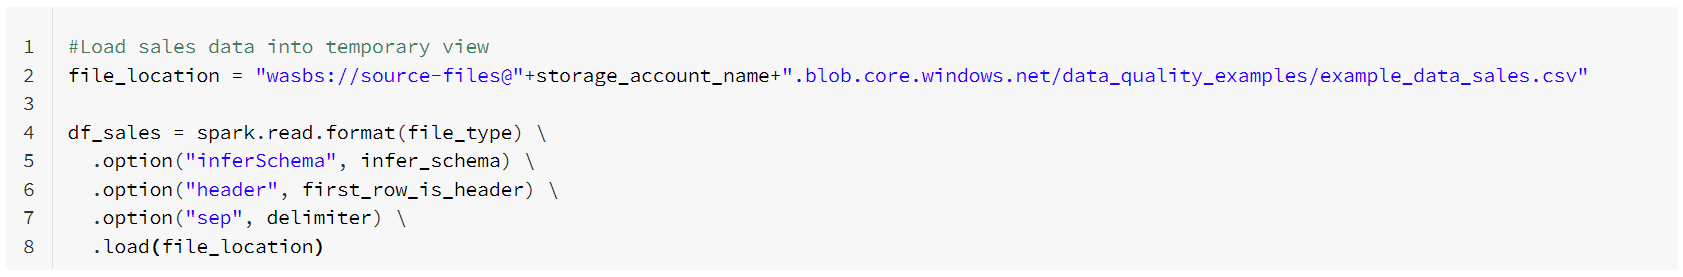
And that is all you need to do to bring your data into Databricks from a blob. And even better if you update the file at some point - you don’t have to change anything. Just rerun the code and you are ready to go.
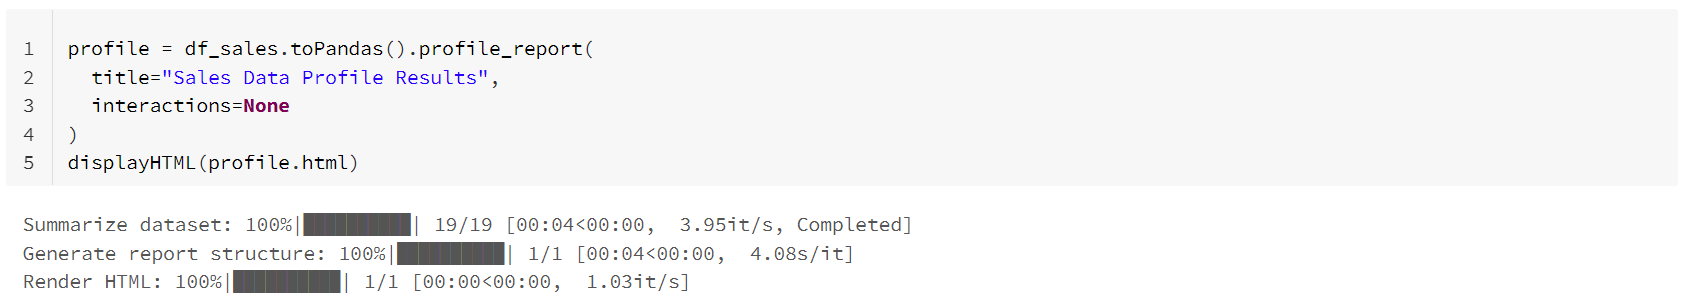
Well, there really aren’t any. Lucky you. Converting spark data frame into Panda and calling for a profiler is all it takes.
![]() One good tip and thing I have noticed though. The interactions-calculations do take a huge amount of time for some data sets. So I have disabled that as a default. There is also a “minimal=True” configuration if you want to get the bear minimum results, but I have found that the rest of the calculations don’t take that long.
One good tip and thing I have noticed though. The interactions-calculations do take a huge amount of time for some data sets. So I have disabled that as a default. There is also a “minimal=True” configuration if you want to get the bear minimum results, but I have found that the rest of the calculations don’t take that long.
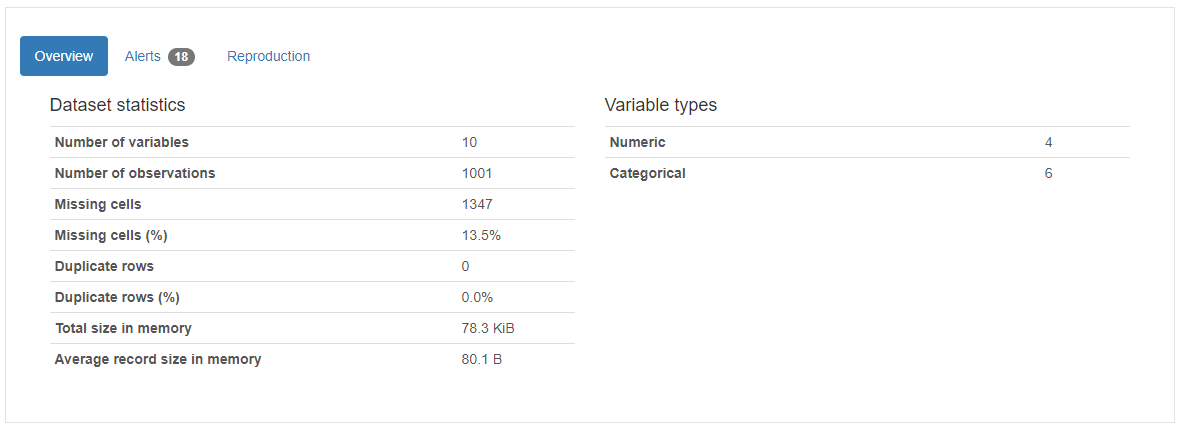
That’s it. We are done. Ready to see the results? The nice thing about Pandas profiling (also with Databricks) is that you can view the results in an easy to ingest, human friendly, understandable and presentable html page format. I would also claim that it’s something that you can show and discuss with a business specialist directly. The profile report is quite long, so let´s brake it down into parts.
An almost perfect first date
I had a lot of fun when I was testing data profiling for the first time. I was using a data set that I had previously generated to do data quality checks, so I knew it wasn’t perfect, but the most fun part was that I found a mistake that I had made while populating the data set. I will get back to that but let’s see what we get out of the box with this profiling report.
First part consists of an overview and some warnings. Nothing highly interesting on the first view, except maybe the duplicate rows count. If you are not expecting those then that should definitely be zero. Most of the other parts you usually know beforehand. One nice thing I happily noticed from my results was the correlation between customer_id and check_invalid. That never occurred to me but I did use only a few selected customer ids where I made my "data quality issues" occur and inserted a row specific data quality description into the check_invalid-column. It was fun to see that this correlation was actually found!
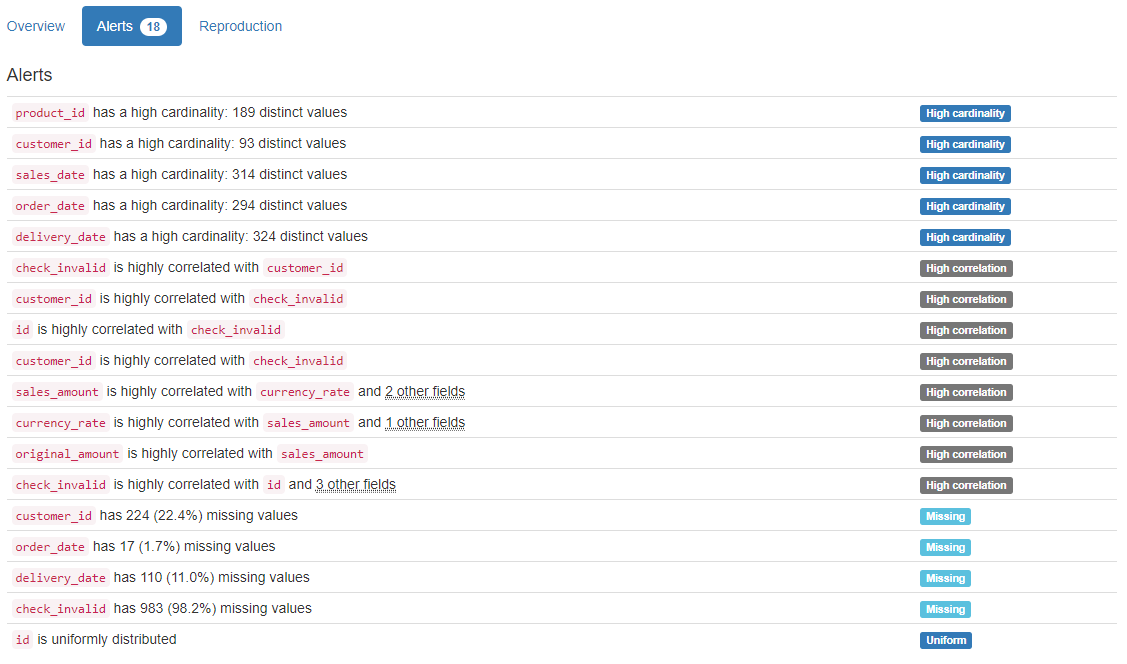
One of the most common problems in data is missing values in foreign key id columns. Meaning that, for an example on a sales order, there are no customer id value. That pretty much makes the data set unusable for multiple practical use cases. Another case in analysis development is when the example data set provided to you to create a report has only one customer in it. Making a calculation of how much that customer’s sales has gone up compared to the overall sales wouldn’t make much sense anymore.
Now we´re talking
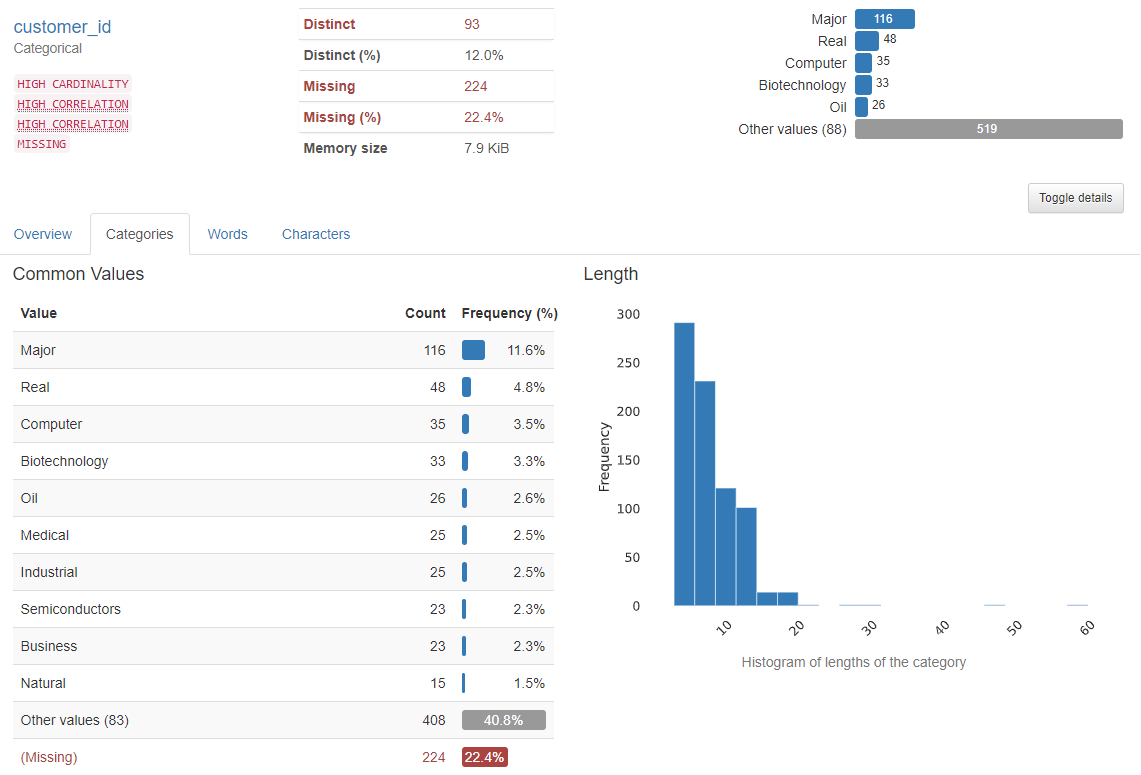
The good thing is that profile results give quite a nice view of the data distribution of a categorical column. Not forgetting the missing values either. I think we would need to have a little talk with some process owner if customer information was missing from over one fifth of the rows 😊 Not sure if there is much usage for the length histogram but if I were modelling this into SQL database then maximum length would be quite useful information determining appropriate column lengths.
Numbers don´t lie
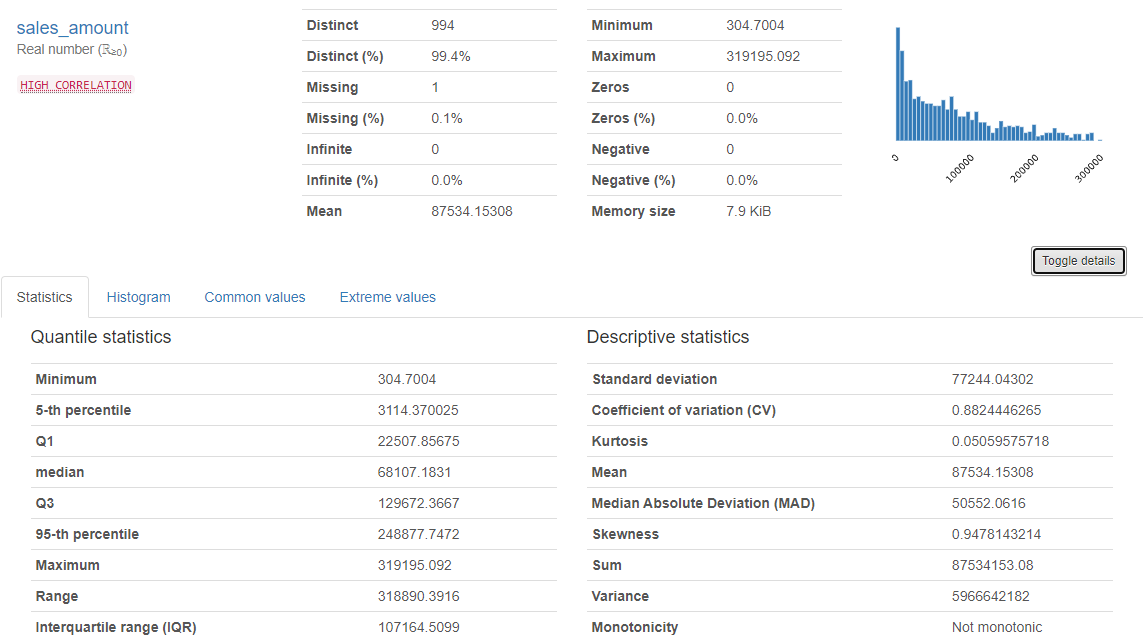
Or do they? Well I suppose it depends on the quality of the numbers. Sometimes we don’t know what to expect from a numerical column. Is it evenly distributed? Does it follow normal distribution? Has it any outliers? If so what are they? Do we have negative values? And so on. Depending on what data we have, there might be quite strong assumptions about it. And man, is it a good practice to check that those assumptions are correct. This is what we get from the profiler for a numerical attribute.
Understanding outliers
I especially like the distribution bin graph. Also things like zeros and negative values counts are really useful yet simple. Some statistical results in there as well. I´m especially fond of the 5-th and 95-th percentiles. From extreme values you can also see the top 10 minimum and maximum values for the column which helps to understand outliers if you have them. I also noticed that transforming my dates (string) into yyyyMMdd integers helped to review date columns quite nicely.
I want my identifier to be unique!
Now to the part that gave me most giggles. One of the most crucial and important things to do when creating any kind of historizing logic is to check that a row can be identified. Why is it important? Because how would a process otherwise know which row has been changed or removed? So basically if I can’t identify my rows then I can’t check which of them have changed because I can’t find the old one to compare with the new. Furthermore if loading logic, like Data vault hub load or persistence staging layer loading, was built on the assumption that it can identify the rows, we need to be sure it’s possible or we will get masses of unwanted changes. So back to profiling my data set. And was I baffled to see this:
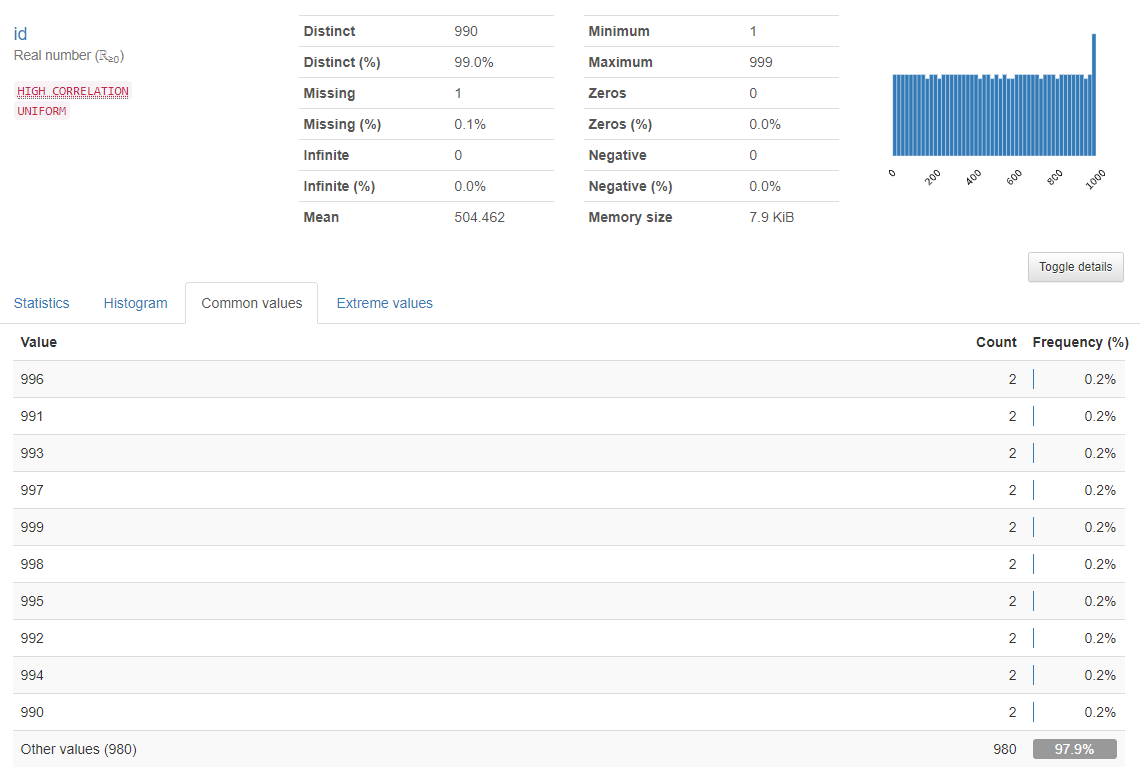
My identification column (id) is 99.0% unique. What the heck?! Good thing there is a Common values-tab in the results. And sure enough it says that some of the id values do have multiple occurrences. I actually had to check if this was true and yes, it was. I had messed up the data population process at some point and I was so excited for finding this out.
I absolutely love my pandas now
So here we are. And is there anything else I can really say? Well, let me at least try to sum this up. When the initial setup for an environment is made, it takes roughly a few minutes to get a result from a totally new data set. That sums up the easiness of this process quite well. I mean, one can hardly create a loading process from a file into a SQL database in that same time. The second thing is the depth of the information this profiling report gives out of the box. It’s absolutely amazing. The third thing is that, if some extra effort is put into modelling the data, there is a quite effortless way to add things like validating foreign key relations, checking business key uniqueness and creating row level calculation checks. And the best part is that when data is updated the profiling can simply be rerun and a new exiting report is just waiting for a dedicated data developer to make the most of it. So if you didn’t already know: pandas are amazing. Both the bears and the profiling tool. 😊